Skip to content

Data and indicators

Data, dashboards, and Business Intelligence

When information lives in separate spreadsheets and systems, teams report different numbers. We organize sources, define indicators, and build dashboards that support real decisions.

Reliable indicators for confident decisions are missing.
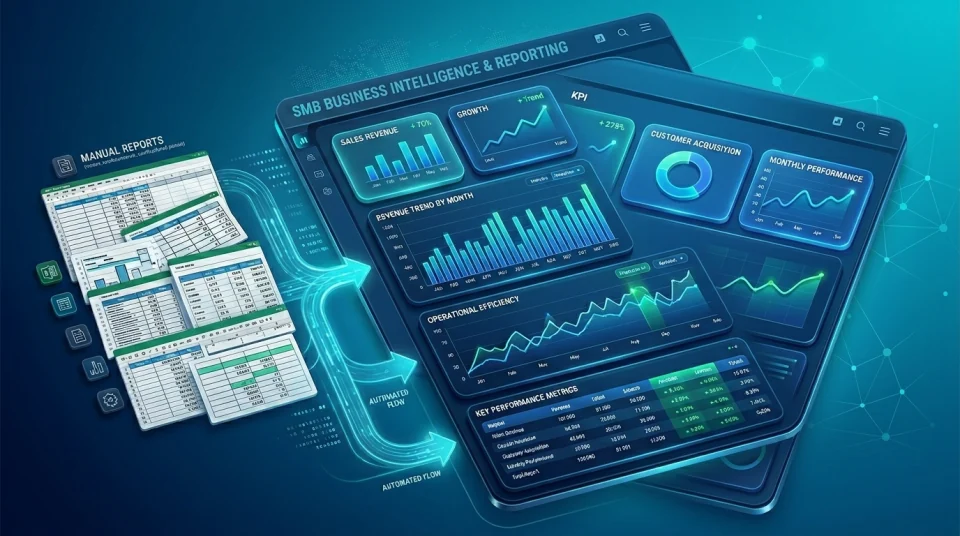
Illustration of data sources feeding dashboards and indicators that support decisions

Capability illustration

Scenarios

Common situations

Signals that this service may be the right starting point.

Numbers that do not match

What usually happens
Sales, finance, and operations present different figures for the same period and nobody knows which version to trust.
What we would examine
Information sources, indicator definitions, owners, and points where data is copied by hand.

Reports that arrive too late

What usually happens
Preparing the monthly report takes days of manual consolidation, and by the time it arrives it no longer reflects current operations.
What we would examine
Refresh frequency, data quality, consolidation processes, and the audience that needs the information.

Dashboards without decisions

What usually happens
Screens with charts exist, but they do not answer the questions management needs in order to act.
What we would examine
Decisions each view must support, alert thresholds, drill-down paths, and useful refresh frequency.

Data scattered across systems

What usually happens
CRM, ERP, spreadsheets, and portals hold pieces of the same customer or process without a consolidated view.
What we would examine
Source inventory, duplicates, integration options, and role-based access permissions.

Assessment

What we review during discovery

Items that typically enter initial assessment scope.

  • Current information sources and their quality
  • Spreadsheets and reports in use
  • Indicator definitions and owners
  • Duplicates and manual copies before analysis
  • Refresh frequency and access permissions
  • Integration options between systems
  • Reporting audiences and decisions they must support
  • Historical, security, and privacy requirements

Reliable information

From scattered data to reliable information

Before drawing charts, we align definitions, sources, and owners so the dashboard does not multiply errors.

  • Common indicator definitions across teams
  • One trusted version of information where practical
  • Data sources that can be traced to their origin
  • Automated consolidation that reduces manual copies
  • Visibility of exceptions and incomplete data
  • Clear ownership and role-appropriate access

Useful dashboards

Dashboards designed to support decisions

A useful dashboard answers concrete questions: what is out of range, who should act, and how often the view refreshes.

  • Decision context each view must support
  • Relevant indicators, not an inventory of everything measurable
  • Operational needs versus executive views
  • Alerts and thresholds when a result needs attention
  • Drill-down paths to understand the cause
  • Update frequency and actionable interpretation

Before and after

What changes with discipline

Before

  • Indicators defined differently in each area
  • Manual consolidation in spreadsheets
  • Reports that arrive after the decision window has passed
  • Broad access without clarity on who may see what

After

  • Indicator catalogue with shared definitions
  • Automated consolidation from agreed sources
  • Operational and management dashboards with defined refresh
  • Role-based permissions and documented sources

We do not promise perfect data quality or assured financial outcomes; value depends on sources, definitions, and real use.

Fit

Who it is for — and who it is not

Good fit

  • You need reliable indicators to operate or manage
  • You have multiple sources and want consolidation with traceability
  • You already use or can use Power BI or other reporting tools
  • You can assign owners for definitions and data quality

Clear boundaries

  • We do not promise perfect data quality
  • We do not generate automatic insight without business context
  • We do not promise financial outcomes
  • We do not offer real-time reporting when source systems cannot support it
  • We do not claim vendor partnership status
  • We do not assume every dashboard requires artificial intelligence

Scope

What a typical project includes

  1. 01Inventory of current sources and reports
  2. 02Indicator definitions and owners
  3. 03Data model and integration design
  4. 04Prototypes and operational or management dashboards
  5. 05Role and permission model
  6. 06Refresh and monitoring approach
  7. 07Documentation, training, and improvement roadmap

Capabilities

Related capabilities

  • Business Intelligence
  • Power Platform
  • Artificial intelligence
  • Digital transformation
  • Development, DevOps, and MLOps

Deliverables

What you can expect to receive

  • Data-source inventory
  • Indicator definition catalogue
  • Data-quality findings
  • Reporting requirements
  • Data model
  • Integration design
  • Dashboard prototypes
  • Operational and management dashboards
  • Role and permission model
  • Refresh and monitoring approach
  • Documentation and training
  • Improvement roadmap

Methodology

How we deliver this service

  1. 01

    Understand decisions and audiences

    We clarify which decisions indicators must support and who uses each view.

  2. 02

    Map sources and quality

    We inventory systems, spreadsheets, and manual copy points; we flag quality risks.

  3. 03

    Define indicators and model

    We agree definitions, owners, and a maintainable data model.

  4. 04

    Build and iterate dashboards

    We deliver prototypes, validate with users, and refine alerts, filters, and permissions.

  5. 05

    Operate and improve

    We leave documentation, training, and an improvement path based on real use.

FAQ

Questions about this service

How do we know which indicators our company needs?

We start from the decisions management and operations must make each week or month—sales, service, costs, compliance, or capacity. With key people we review which questions go unanswered today and which data already exists. We prioritize a few well-defined indicators before expanding the catalogue. The result is an agreed list with formula, source, and owner—not an endless metric inventory.

Can you connect data from different systems?

Yes, when APIs, stable exports, or connectors are available. We assess CRM, ERP, spreadsheets, and other sources by frequency, quality, and permissions. We design integration so it can be operated and monitored—not only demoed. If a source is unstable, we flag it and propose cleaning it up before automating consolidation.

Do we need to replace our spreadsheets?

Not always. Spreadsheets often remain as input or temporary control while the source stabilizes. We aim to reduce repetitive manual copies and leave clear definitions. If a spreadsheet is the only trusted source, we document it and, when useful, integrate or migrate it in phases. Full replacement is proposed only when it improves maintainability and trust.

What is the difference between a report and a dashboard?

A report is usually a point-in-time or periodic delivery with a fixed narrative—figures for a closed period. A dashboard is a living view for checking indicators, filtering, and spotting exceptions at a defined frequency. Both are useful; we choose the format based on the decision and audience. Sometimes the first step is a reliable report, then an operational dashboard.

How do you control who can see each piece of data?

We define a role and permission model aligned with data sensitivity and job responsibilities. We review access in the reporting tool and in source systems when relevant. We document who approves new users and how access is removed when roles change. The goal is useful visibility without exposing data that does not belong.

Can dashboards refresh automatically?

Yes, when sources allow scheduled extraction and quality is sufficient. We agree frequency based on the decision—operational views may need several times a day; management views daily or weekly. We also leave basic monitoring to detect refresh failures. If the source only updates overnight, the dashboard will follow that rhythm—we do not promise artificial real time.

What information do you need to get started?

A description of the decisions you want to improve, samples of current reports, access or screenshots of main sources, and the names of key people by area. With that we prepare an initial meeting to prioritize indicators and estimate effort. You do not need a full data program to start—clarity on the visibility problem is enough.

How much does a Power BI or Business Intelligence project cost?

Cost depends on data sources, data quality, required indicators, the data model, security, automation, and refresh frequency. A dashboard connected to one clean source is different from a project that must first reconcile data from several systems. Indicators should be defined before visual design begins.

View more questions
Do you work with Power BI, Excel, ERP, CRM, and existing databases?

Yes. Information can come from different sources when appropriate connectors, exports, or access methods are available. Before building a dashboard, definitions, relationships, data quality, and ownership should be reviewed to avoid presenting visually attractive numbers that do not reconcile across departments.

Can you automate reports that are currently prepared manually in Excel?

Yes, when the sources and rules can be standardized. The first step is to identify which parts of the report involve extraction, transformation, validation, or human analysis. Automating repetitive preparation can save time, while data-quality controls and business interpretation remain where they are needed.

What is the difference between Power BI, Business Intelligence, and a dashboard?

Business Intelligence is the discipline of turning data into useful information for decisions. Power BI is a platform that can be used to model, analyze, and visualize that information. A dashboard is an interface for presenting indicators. A strong project requires reliable definitions and data in addition to a visualization tool.

Can you build dashboards for sales, operations, inventory, service, or management?

Yes, when the indicators represent real decisions and the data sources can calculate them consistently. The work starts by defining what each audience needs to know, how each metric is calculated, and who owns the underlying data before deciding on charts or visual layout.

How can a company create a reliable source of information when every department uses its own Excel files?

Definitions, ownership, and common identifiers should be agreed before centralizing information. Sources can then be integrated and transformations automated to produce consistent data. A BI tool does not create a single source of truth by itself if each department continues calculating the same indicators differently.

What if our data contains many errors before implementing Power BI?

Data quality should be evaluated before relying on indicators. Part of the project may involve identifying duplicates, missing fields, inconsistent formats, and conflicting rules. A dashboard can make a data problem visible, but it should not hide it behind apparently precise visualizations.

Can Power BI refresh automatically?

Yes, when the sources, connectivity, credentials, and architecture support reliable refresh. The appropriate frequency depends on the business need and the capabilities of each source. Not every indicator needs to update in real time to be useful.

Can access to information in a dashboard be restricted by user?

Yes. Depending on the architecture, permissions and data-level security can be applied so different users only see authorized information. Access design should be part of the data model rather than added at the end as a secondary consideration.

Technologies

Frequent platforms and tools

  • Power BI
  • Power Platform
  • Power Automate
  • Power Apps
  • Microsoft Azure
  • Microsoft 365
  • SharePoint
  • Python

What information does your operation need to see clearly?

Tell us which decisions are made without reliable visibility today and we will review indicators, sources, and useful dashboards together.

Talk about indicators and dashboards

Contact

Contact us

Reach our team on the channel you prefer. Tell us what you want to improve and we will guide the next step.

WhatsApp

Message us directly to discuss your requirement or project.

Open WhatsApp

Phone

Call our team during regular business hours.

+57 322 810 0001

Call now

Email

Send us the details of your question or project.

info@orqui.tech

Send email

Bogotá office

Carrera 62 #98B-22, Office 302A, Bogotá, Colombia

Get directions
· FREE ISO 27001 REVIEW ·